Marco: I've got a micro inverter at each panel. 17 panels 320 watts each. even at 50% I should still see double what I am seeing on this graph, right?
Dave: appreciate the comments, and I agree it doesn't seem to add up here. I have asked Project Solar this same question, haven't seen a response I suspect it's getting bounced around internally there.
Ray: How would I check my net meter? the thing on the side of the house? All it does is have little squares that go left to right when I'm consuming power, and right to left when I'm generating it... are you comparing the numbers on the readout?
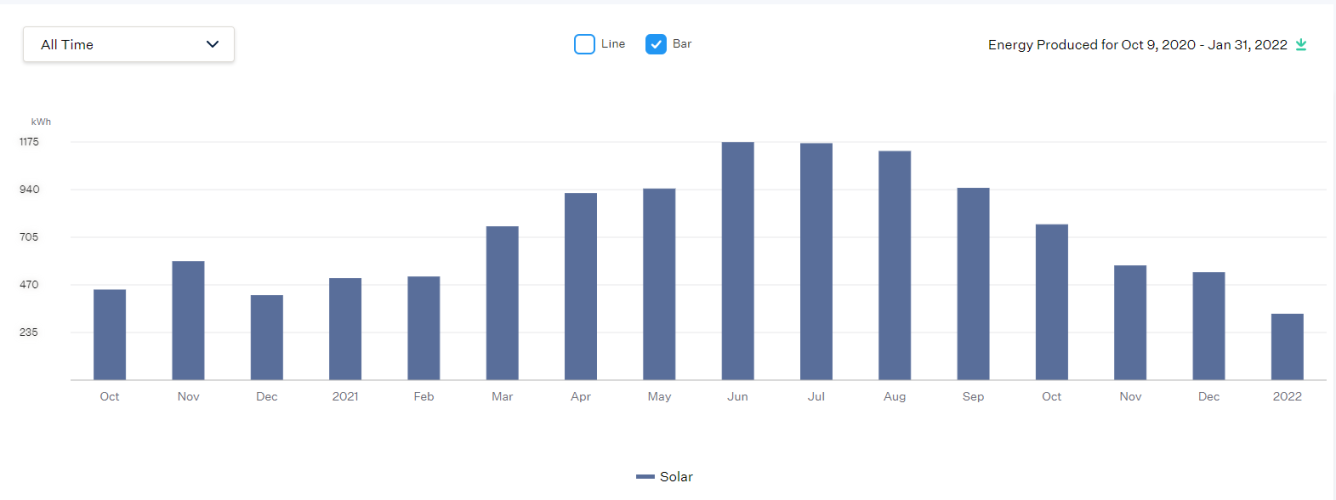
yeah I can graph a month, or a year. Here's January:
So I made 435kWh in 31 days, that's 14 per day. Big difference between the sunny days and cloudy days, no surprise there. But 14x365=5,110, and I have a 5,440 watt system. So this totally adds up to me... once the sun is out for longer that daily average will climb, take a dip again next fall, etc. But maybe I'm getting my units mixed up, still don't know why it would top out like that.
Ken: that graph is the whole array, I don't think I can get indivual graphs on the panels. What I can see though is what each panel does each day? Here is yesterday for example:
View attachment 101598
So the sum of all of those panels is 28.4
") Marco rover67 did his own build
Marco rover67 did his own build